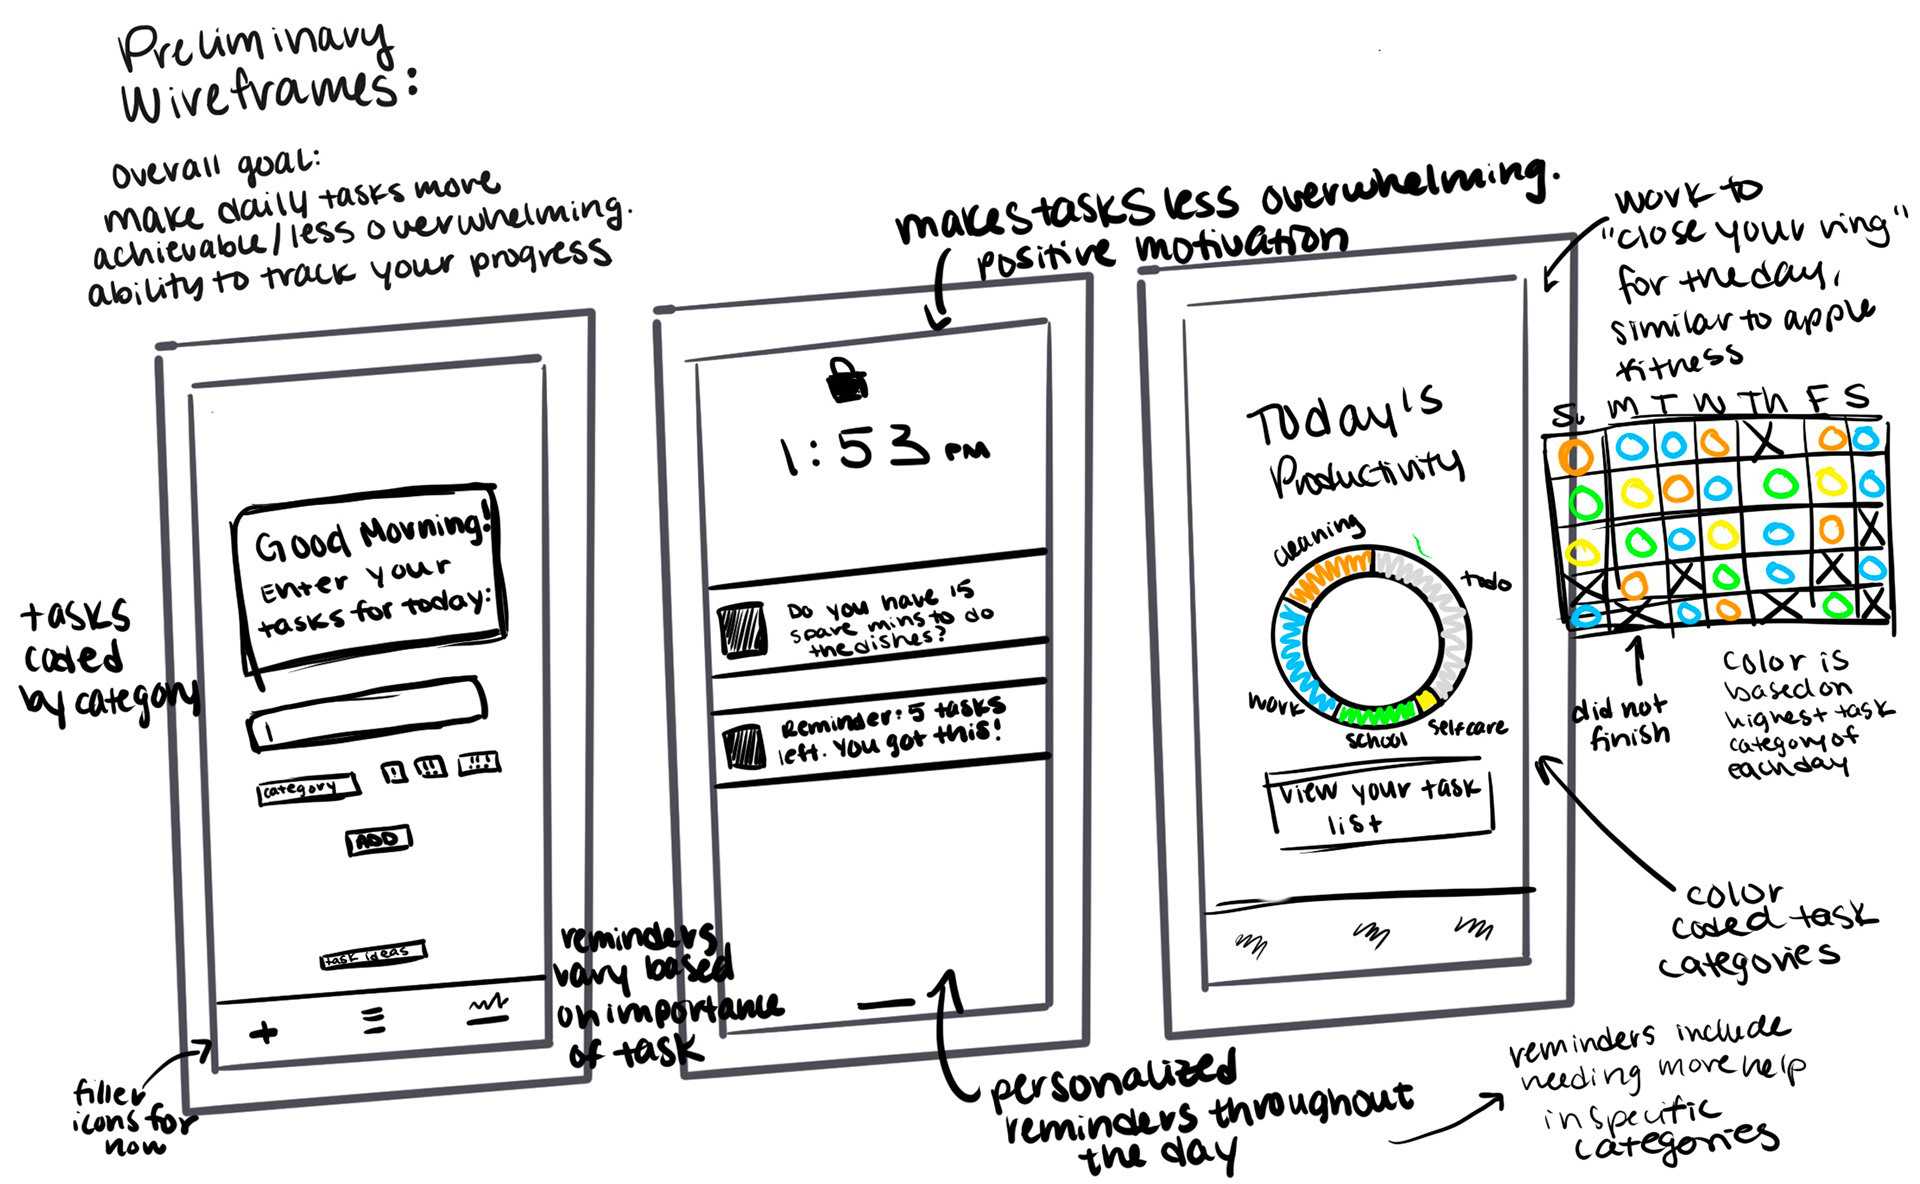
Ideation Sketches:
Below is an initial concept sketch in which I laid out what data I wanted to display. This includes a little bit of data input which turned out to not be within this project's scope.
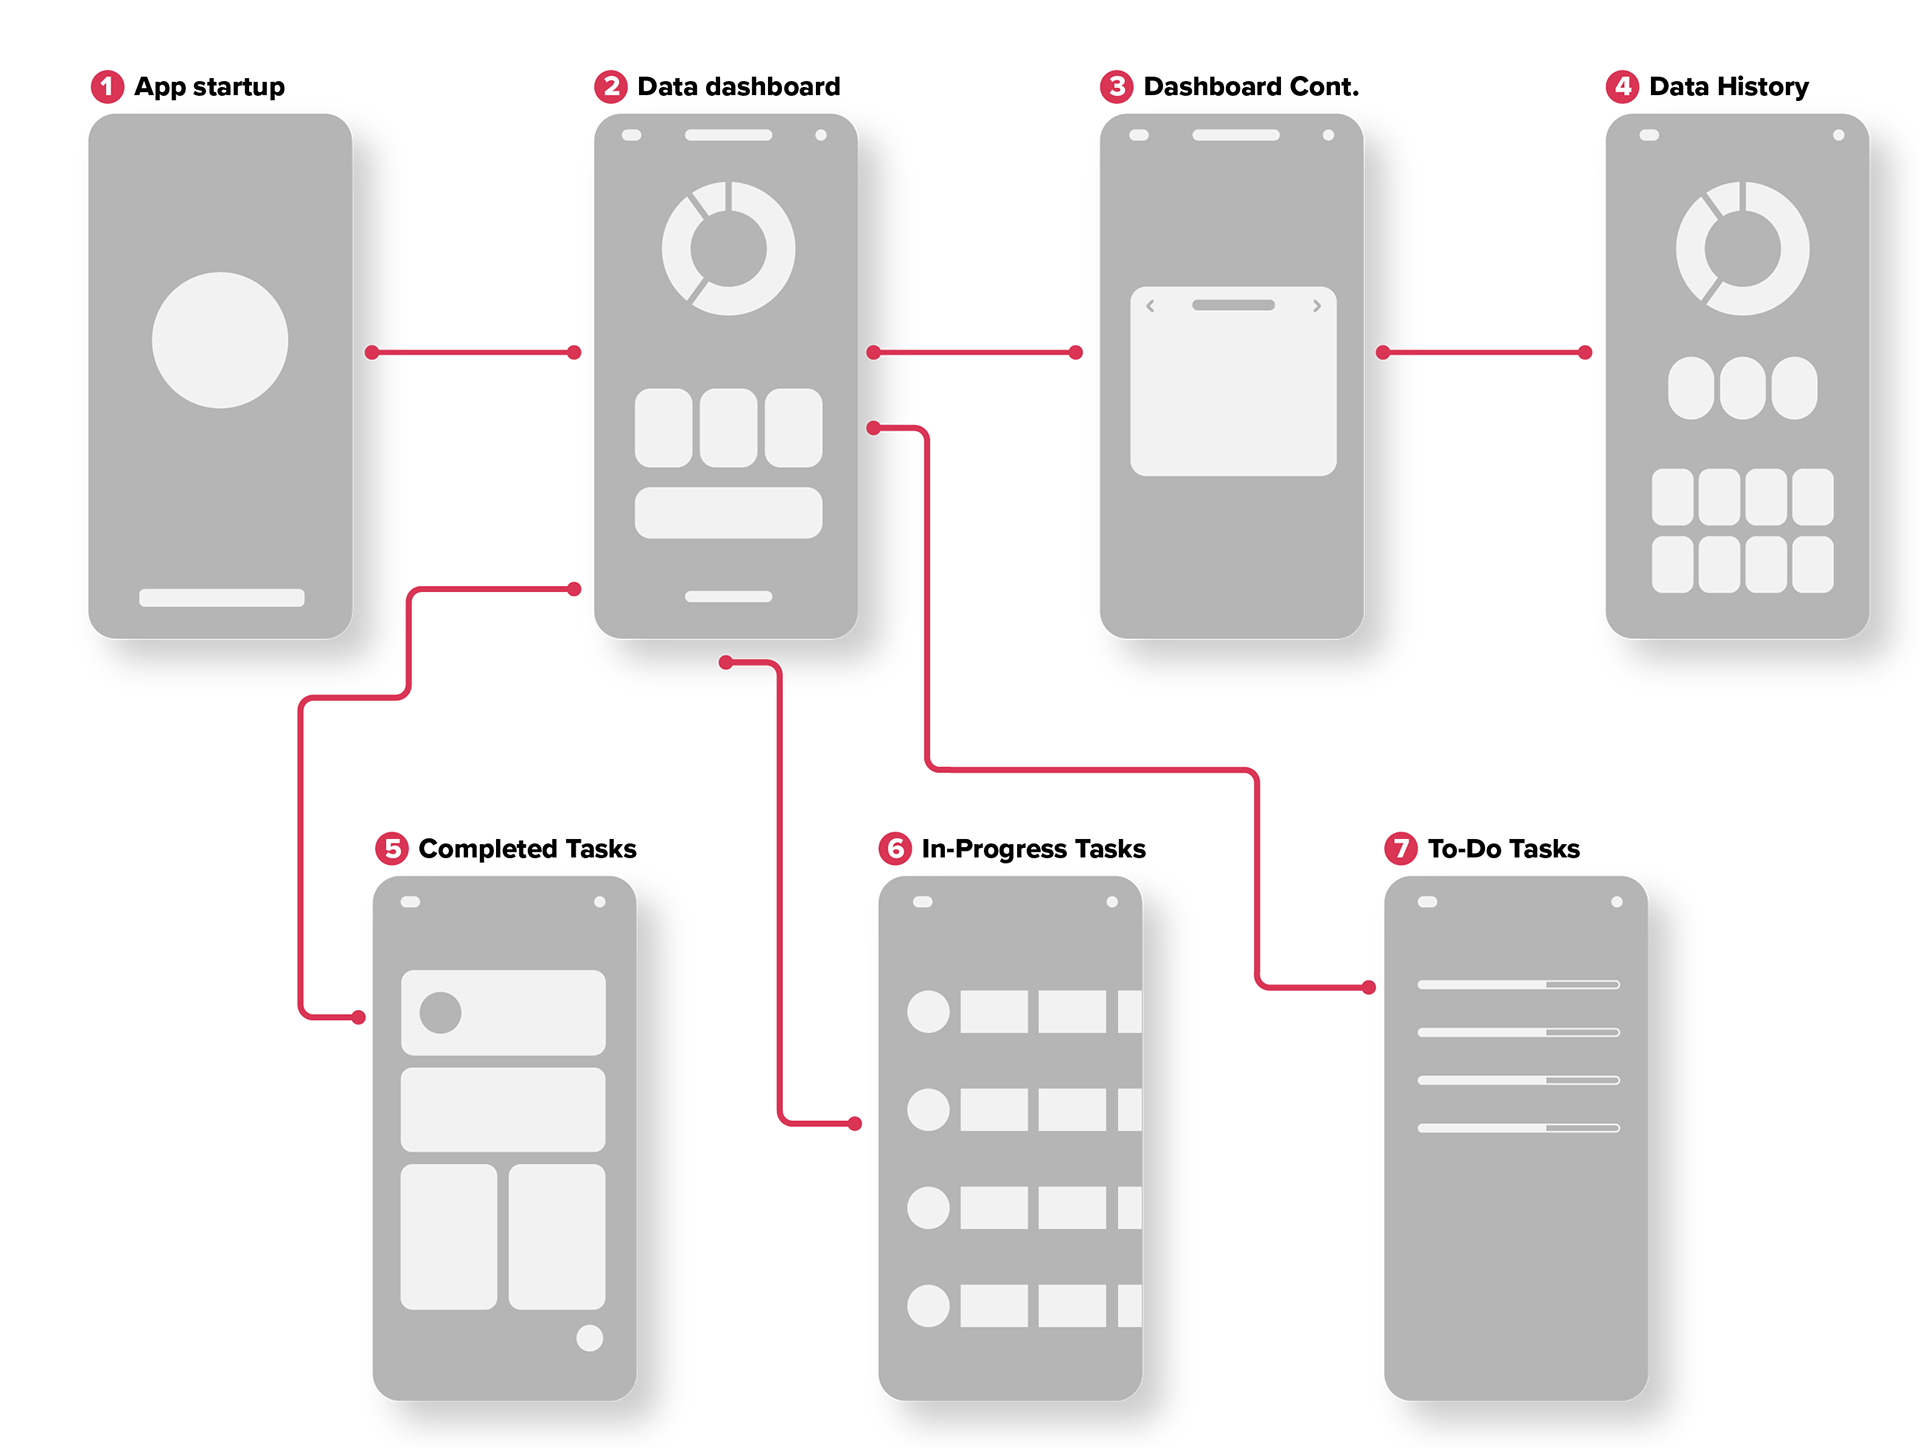
Wireflow:
The image below displays low-fi wireframes with lines showing which buttons navigate to which wireframes. This step helped me to visualize the navigation through app screens.
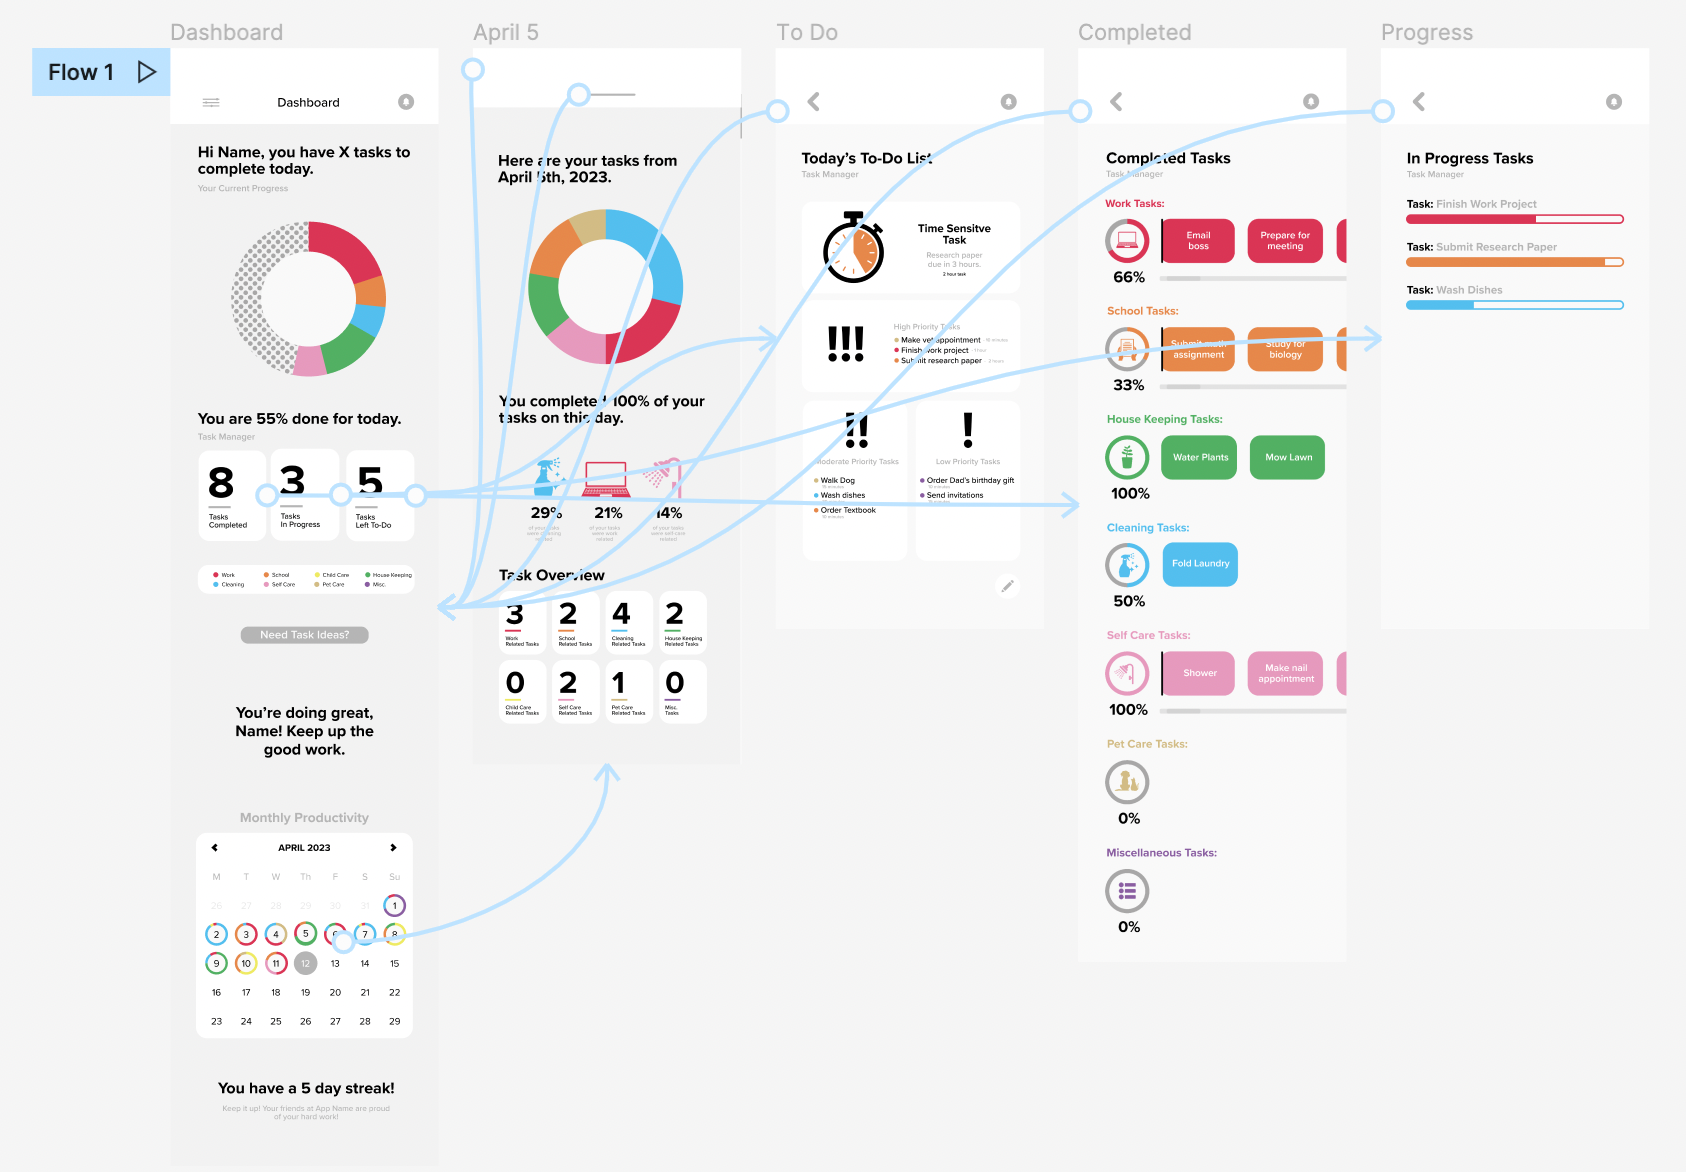
Below is a wireflow with hi-fi wireframes directly from figma.
Data Sources:
Below you can see how data is tracked through the dashboard and why each source of data is important to support the target behavior of the users. Green explains what is being shown and orange explains importance.
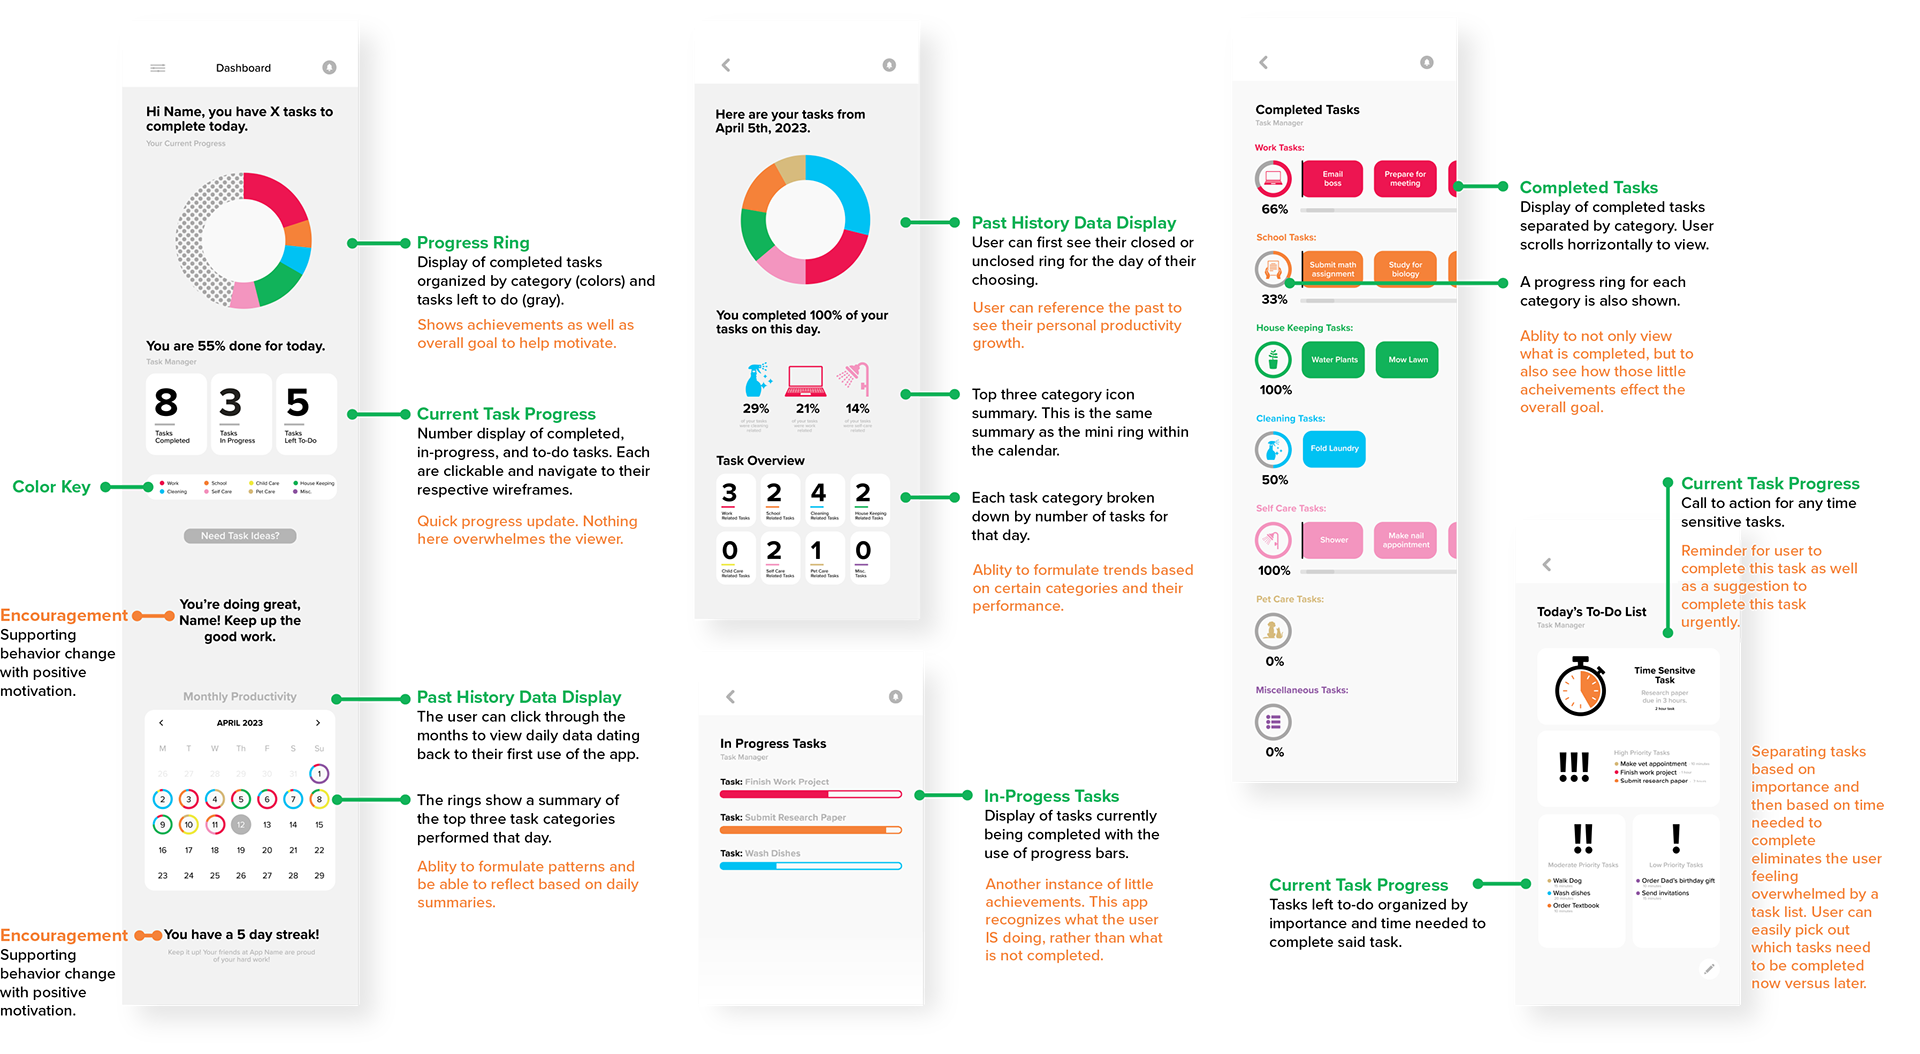
Click to enlarge.
Testing Plan and results:
I used Useberry to perform 4 first click tests and one heat map evaluation. My goal for the first click tests were to make sure my buttons used to navigate through wireframes were very clear to any user, which proved to be the case. My participants ranged in age, background, and graphic design knowledge, allowing for as much of a non-biased study as I could get. All four of my first click tests had a 100% success rate, and with a range of 1-3 seconds for the average click time. The heat map (shown below) allowed for me to see where users are clicking besides the buttons I made them aware of, which are marked in blue.
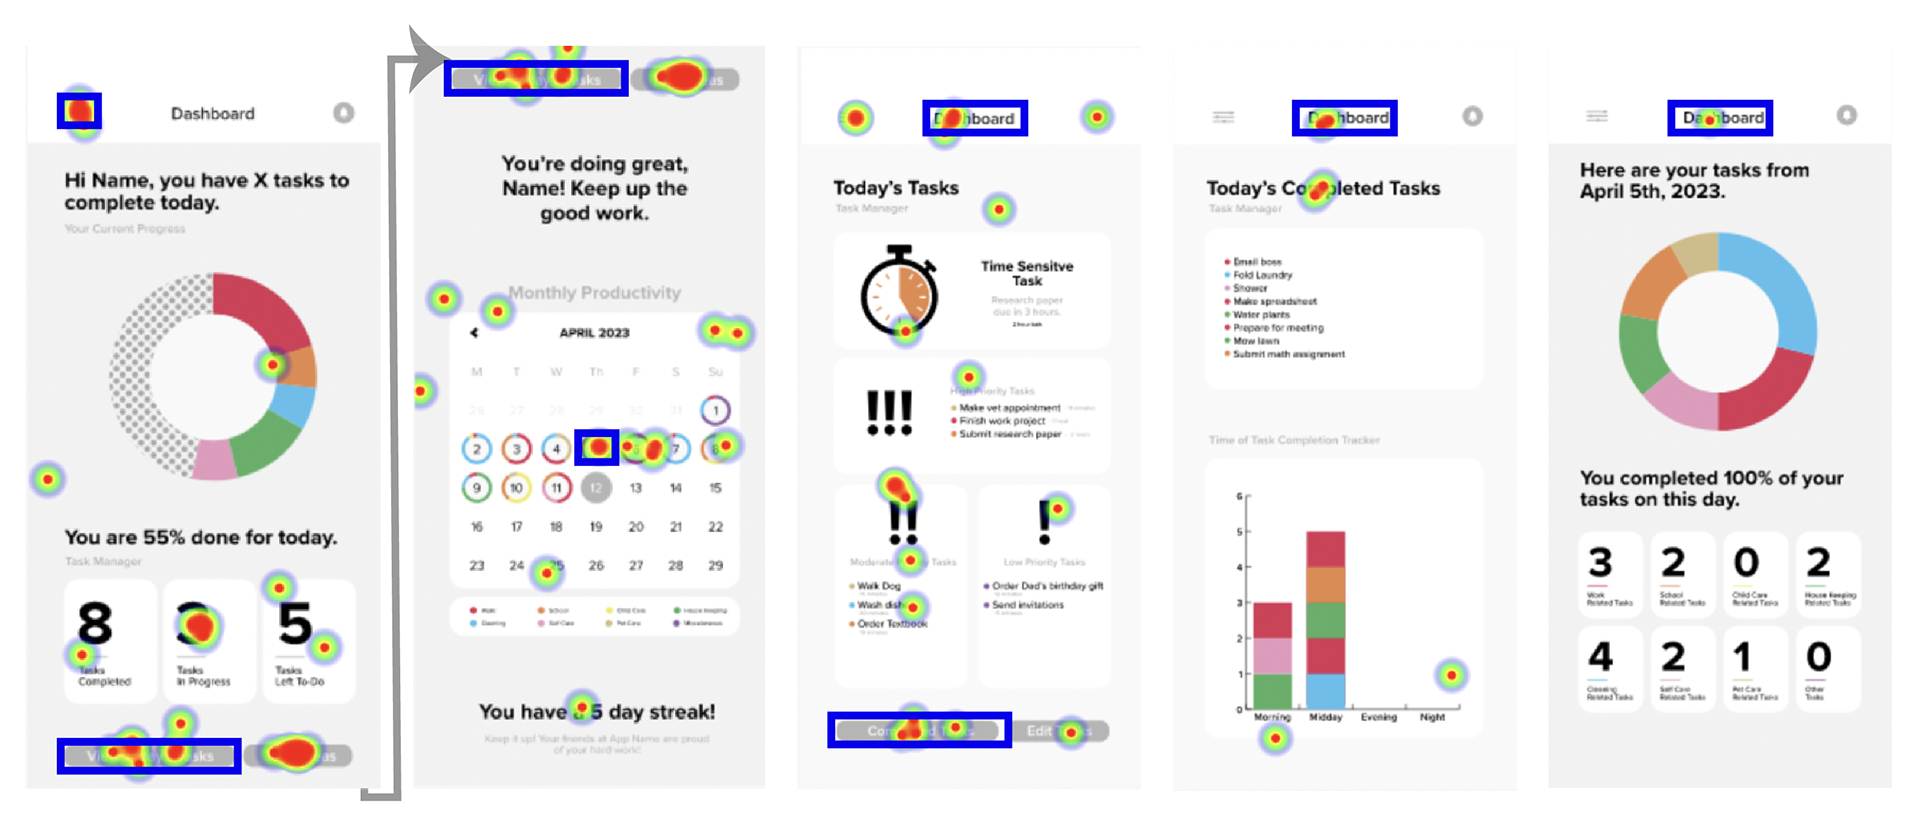
This test inspired some design changes and also showed me what areas I should consider allowing navigation for in the future. Again, this assignment only focuses on data display, not data input, so this insight would be extremely helpful for my thesis, if I choose to further develop this app, but not for this project specifically.
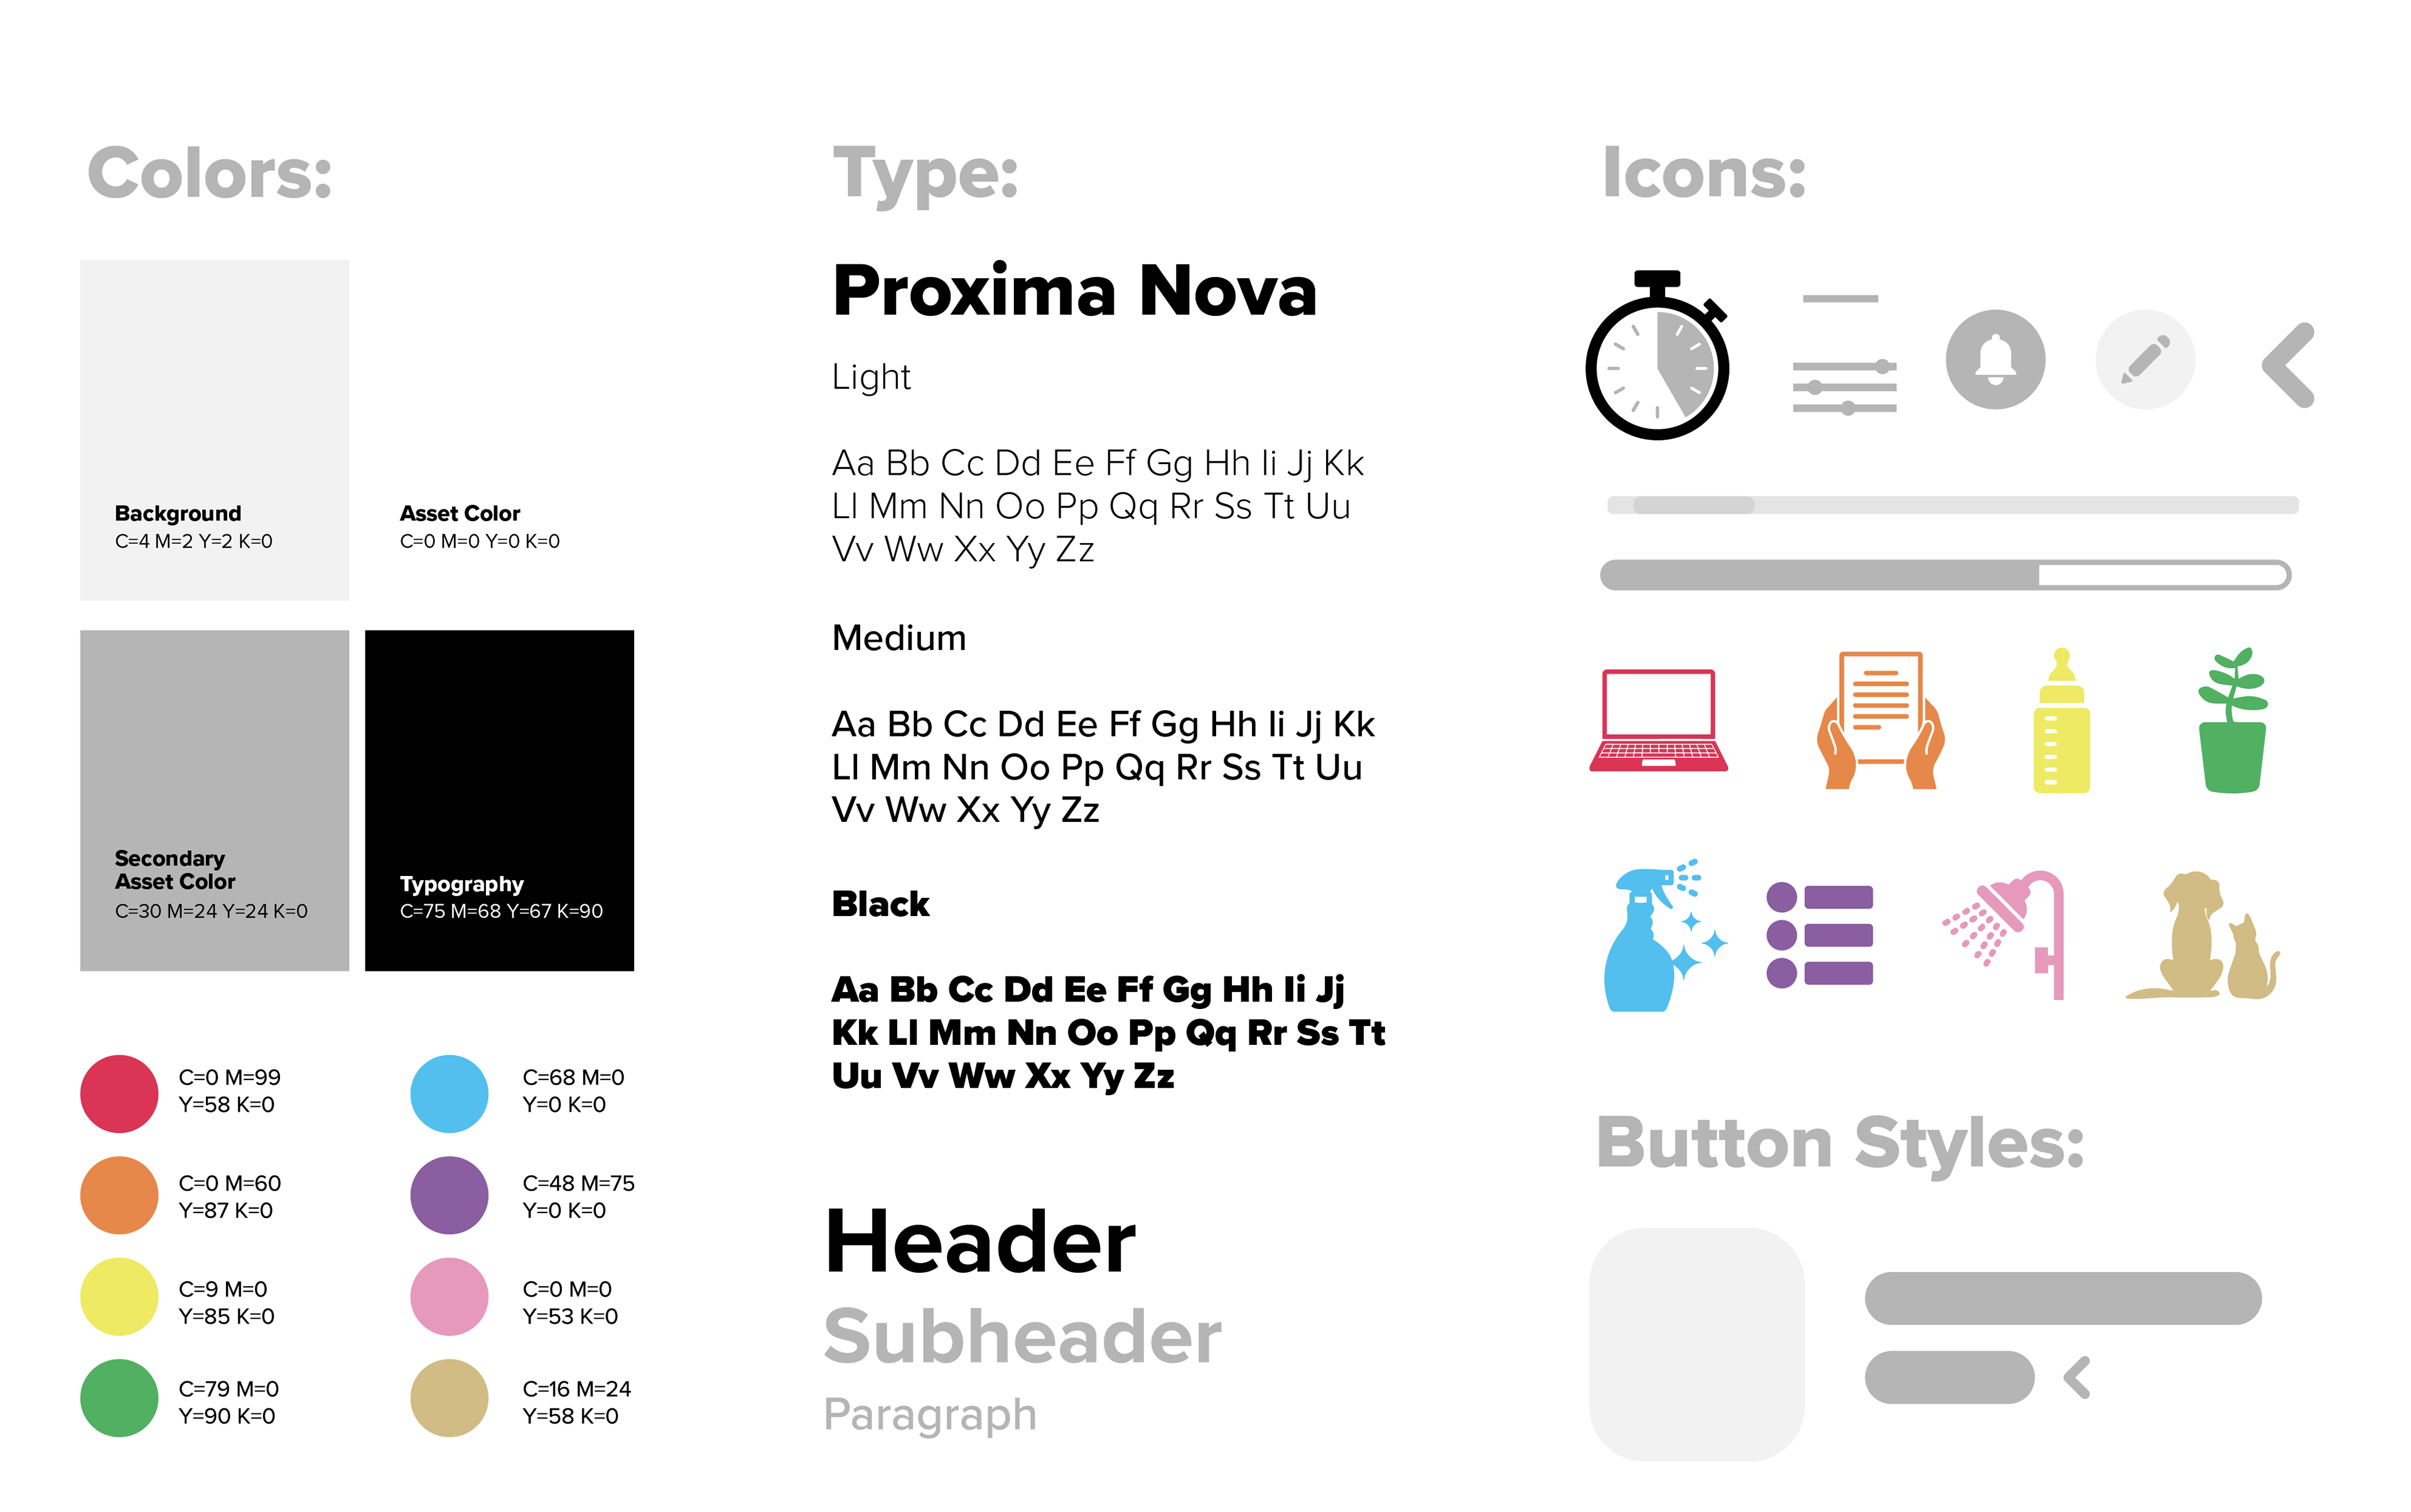
UI Style Guide:
Below is the UI style guide for this app, showcasing colors, my chosen typeface, and graphic elements used throughout the wireframes. The colors were chosen based on research within each of the categories.
Interactive Prototype:
Below is a video prototype of my final data dashboard.
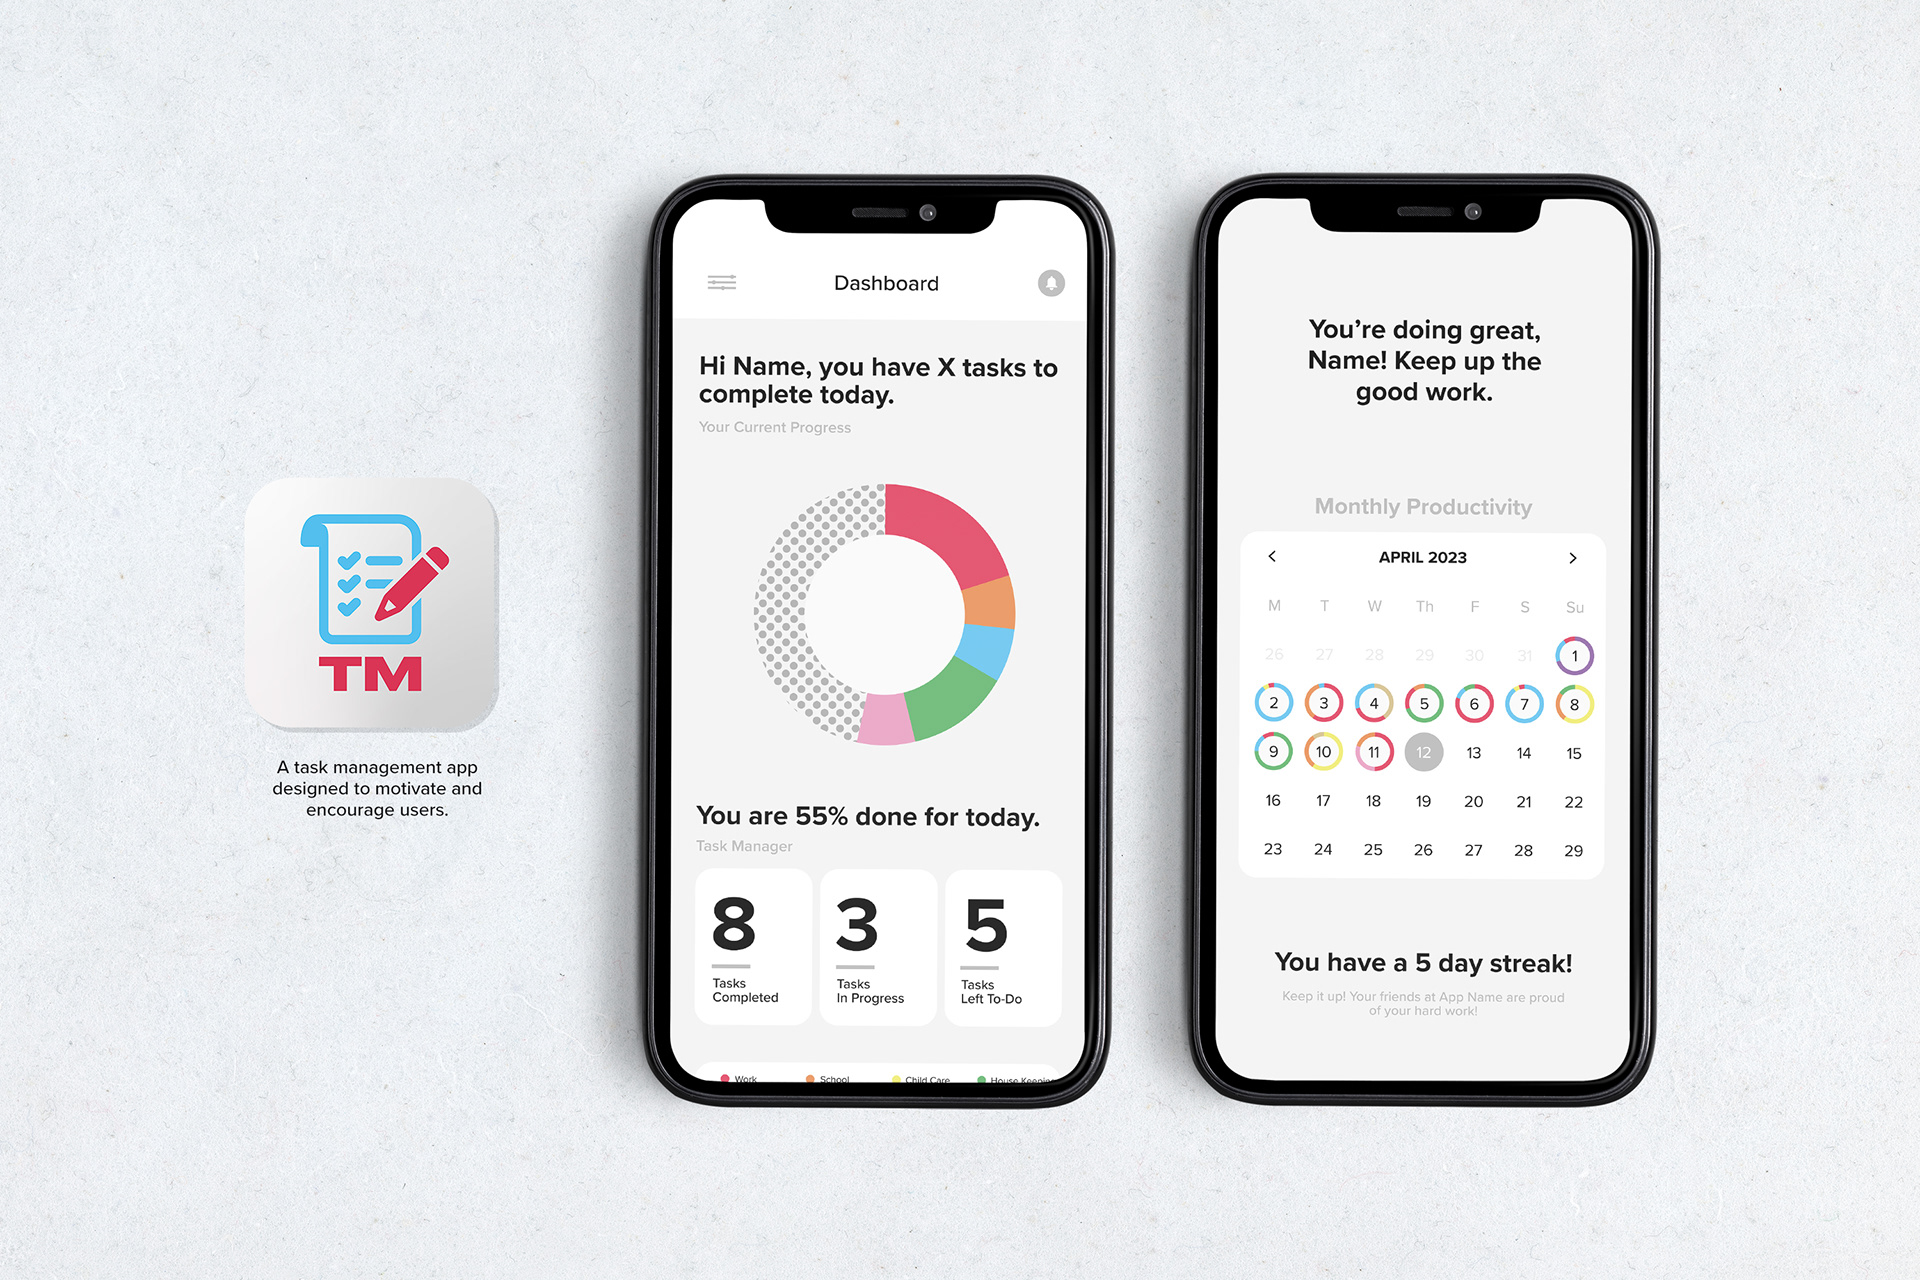
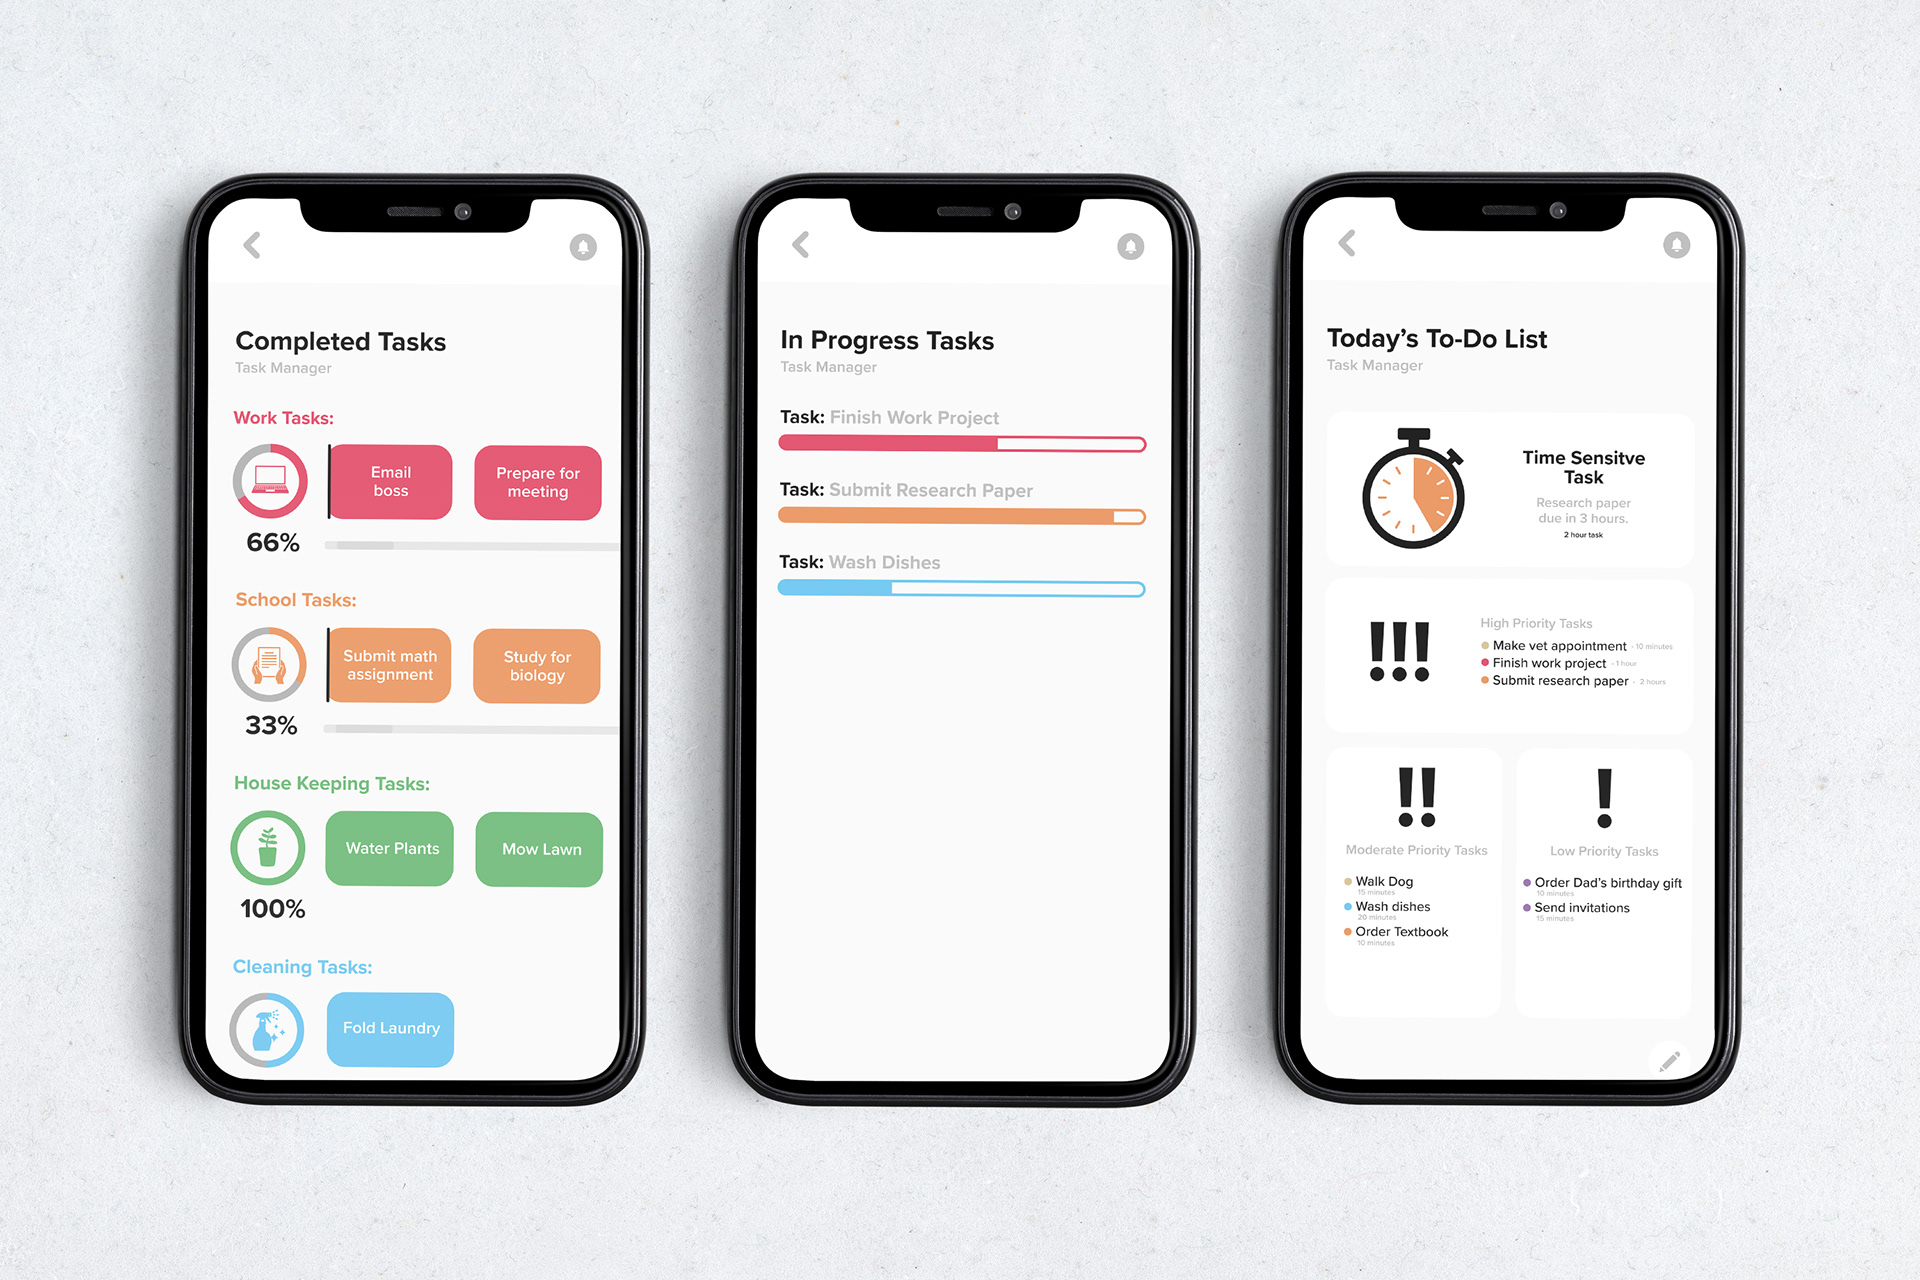
Final Data Dashboard:
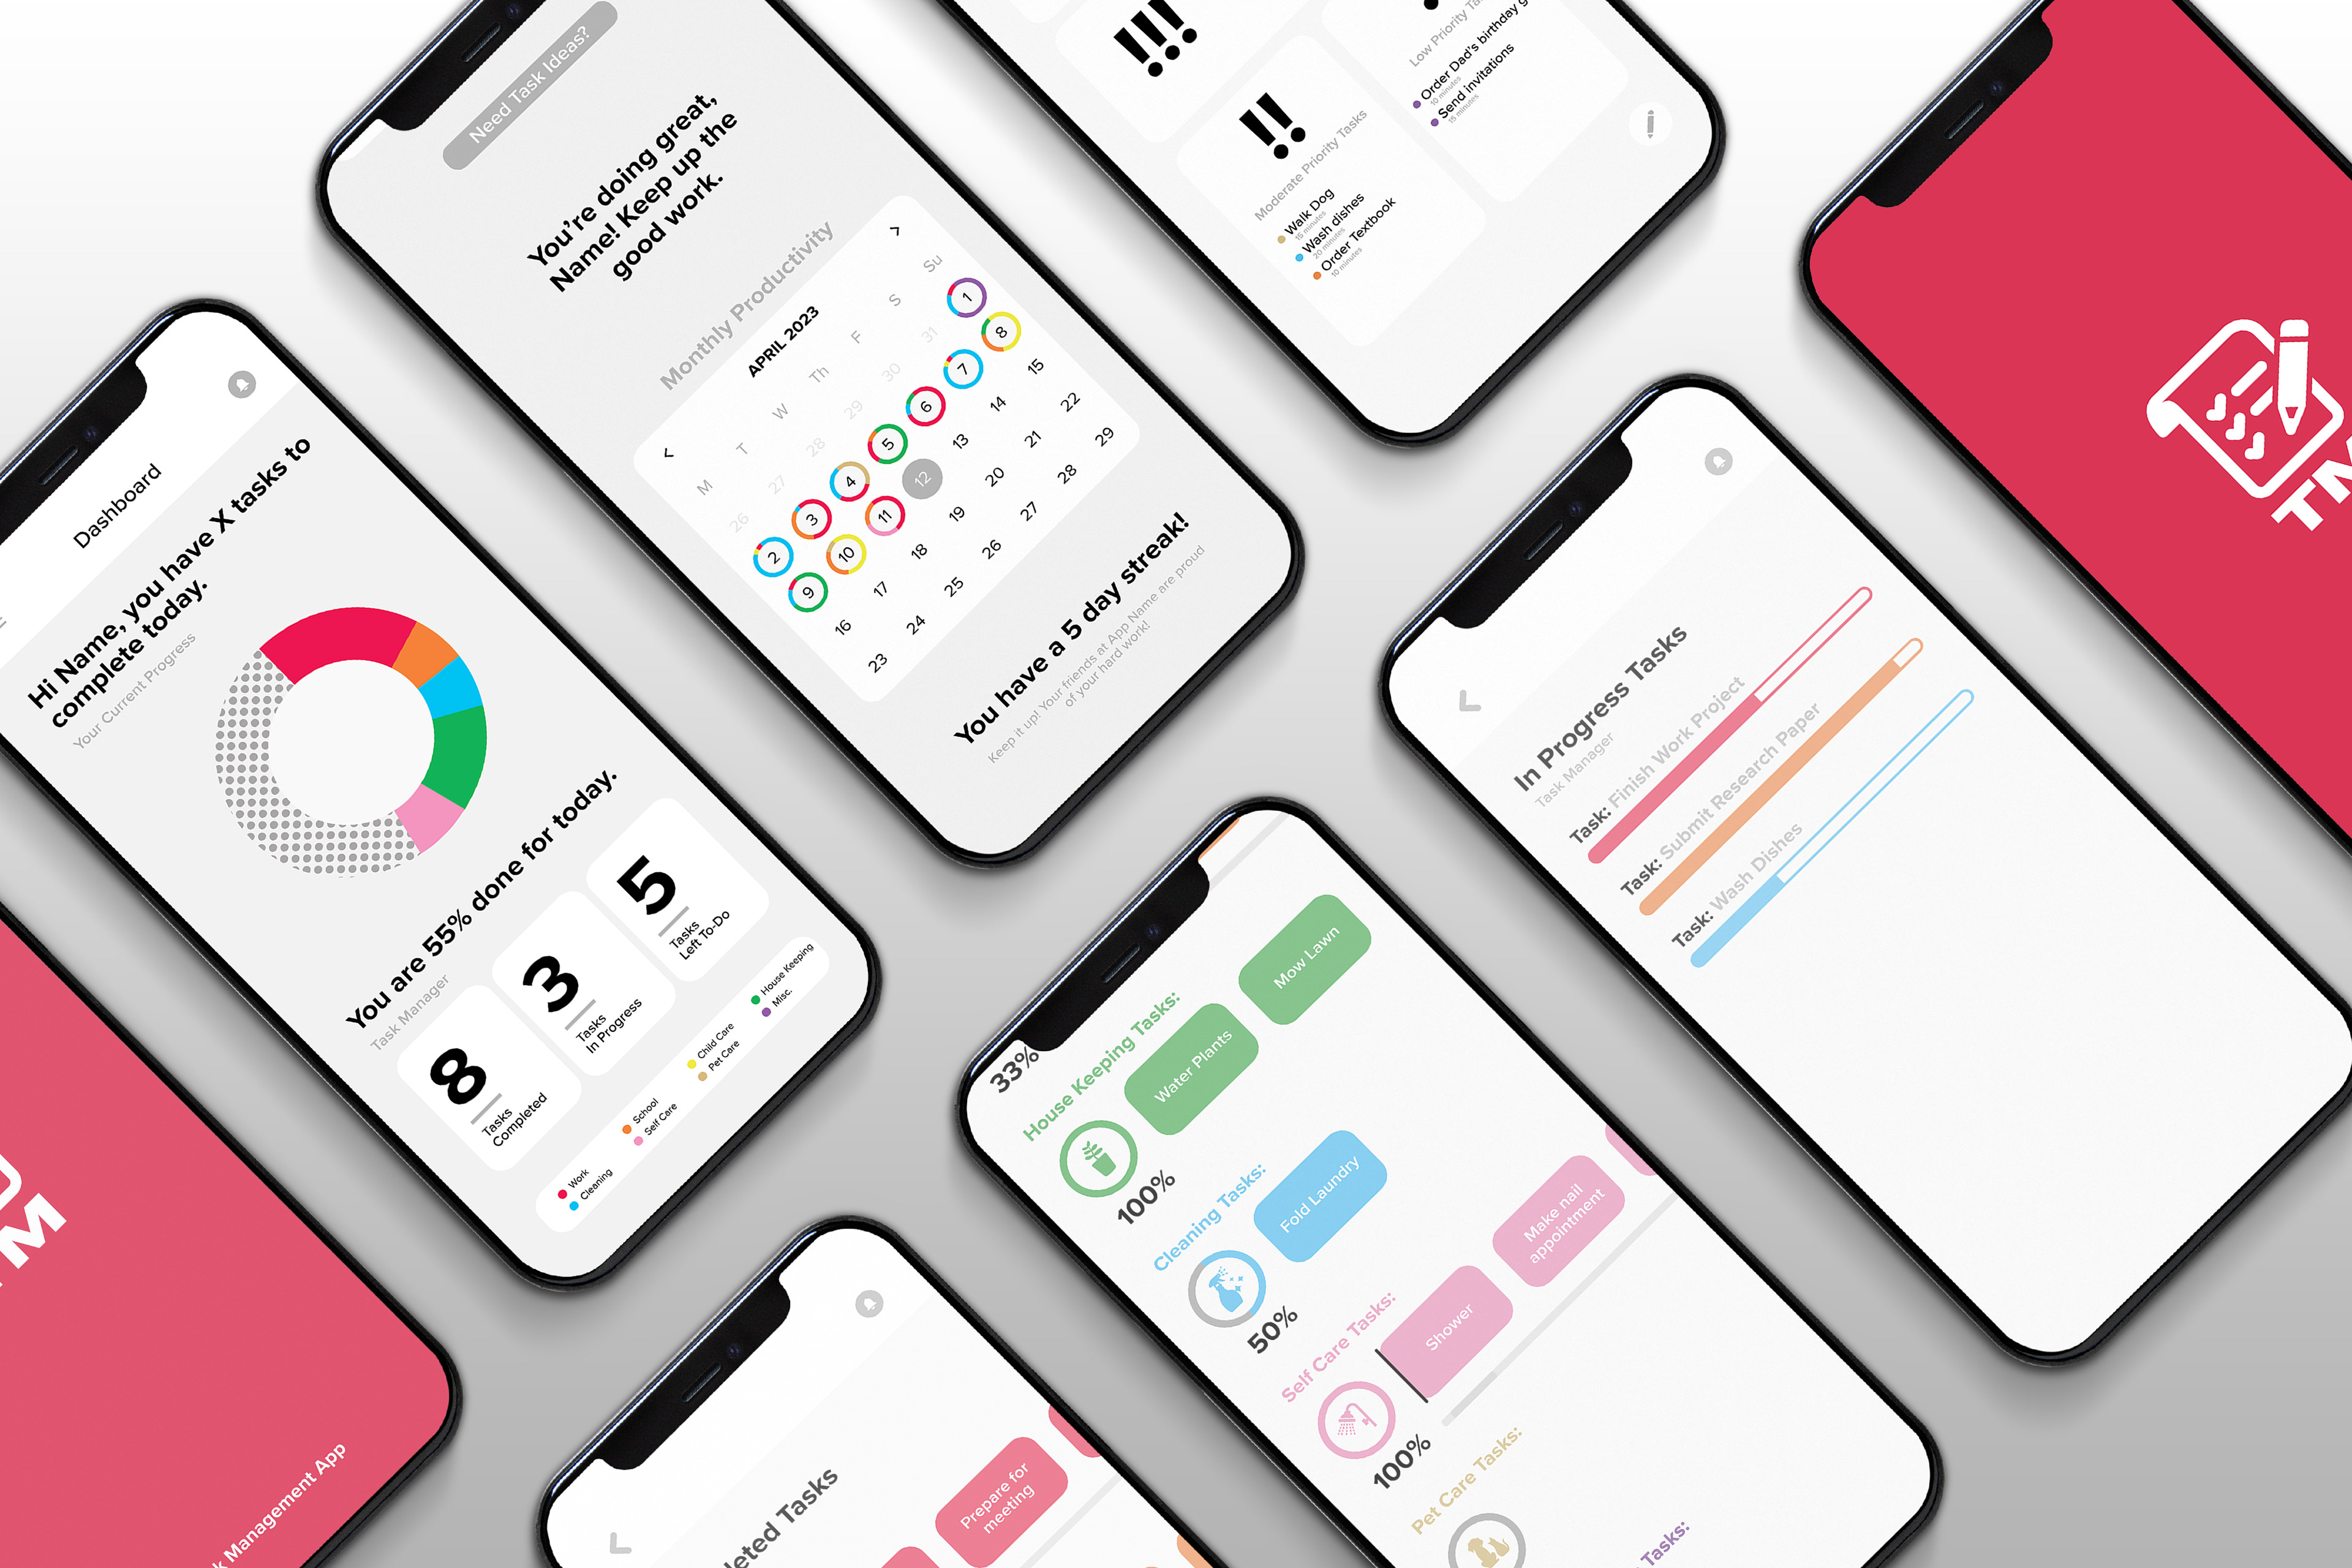
Softwares Used:
Adobe Illustrator, Adobe XD, Figma
Reflection:
I enjoyed learning about UI design and have discovered a possible career path with the help of this project. I love the mix of graphic design and practical research that goes into this field and am interested in gaining more experiences in this realm.